Economic Data Watch and Market Outlook
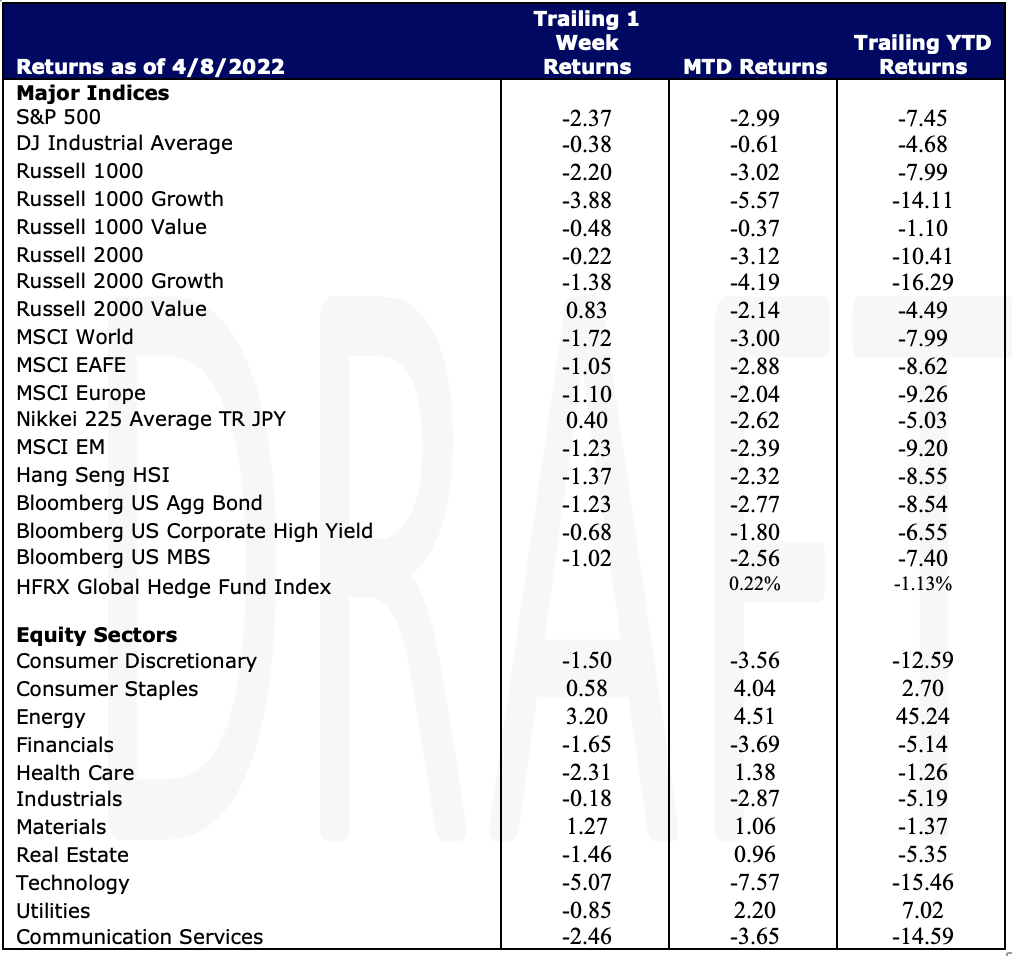
Global Equities fell 1.72% for the week with US stocks dropping 2.37%. Fears continue to mount regarding inflation and the impact it will have on the global asset prices. The US Aggregate Bond index fell 1.23% for the week.
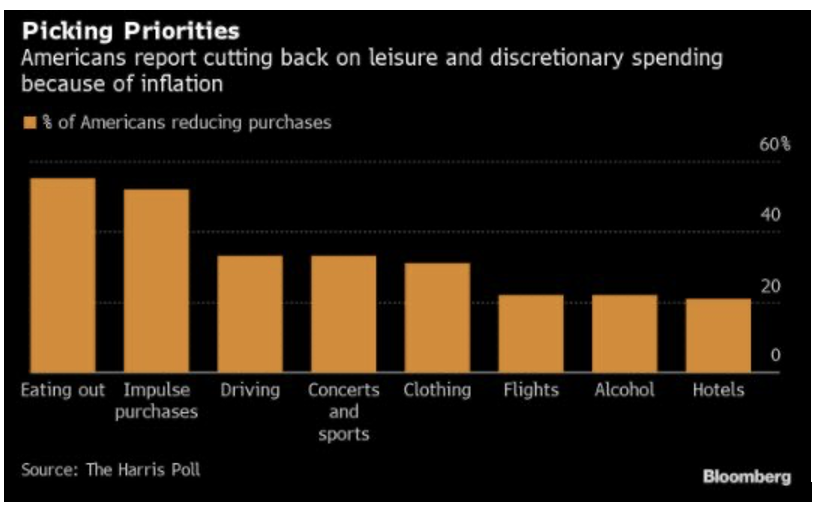
According to a recent Harris Poll, 84% of Americans are planning to cut back on spending due to rising prices. Most common are eating out and impulse purchases. What is interesting is that the poll of 2,100 Americans was conducted before the 8.5% inflation increase was announced. More significantly is that 70% of respondents noted that they are “feeling the effects” of higher gas and food prices.
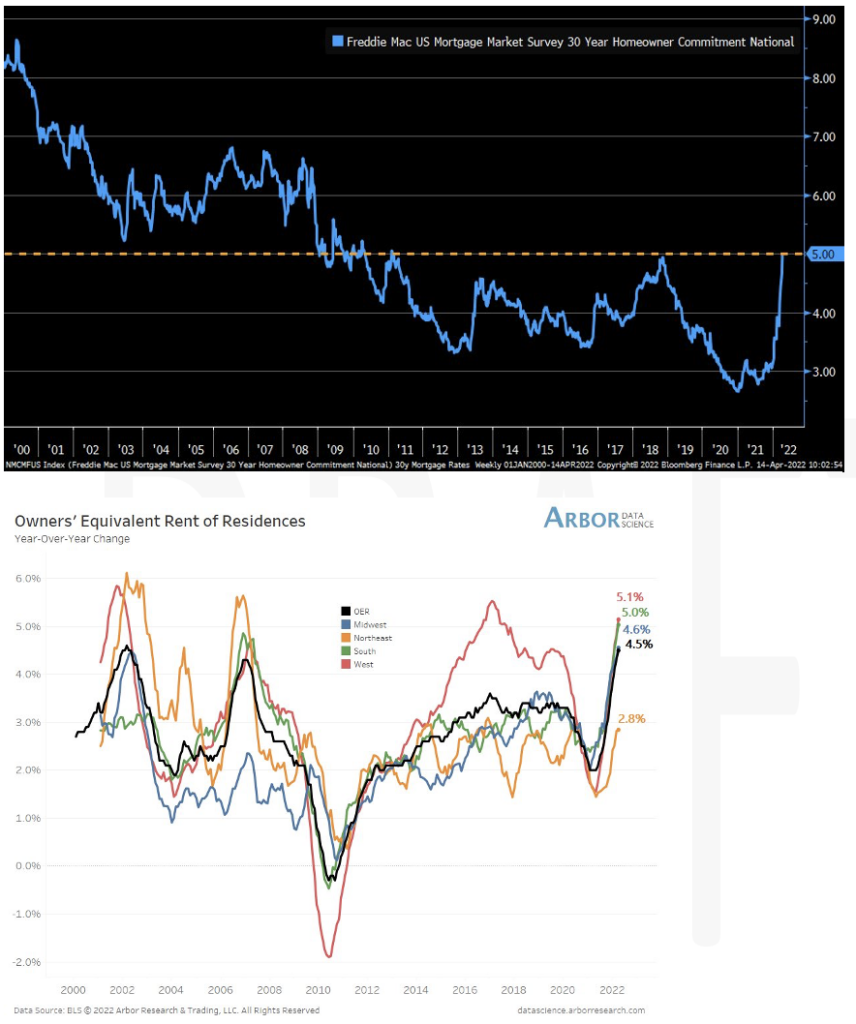
Housing pressures continue as well. Mortgage rates hit 5% during the week, the first time since 2011. Rents have also increased roughly 4.5%.
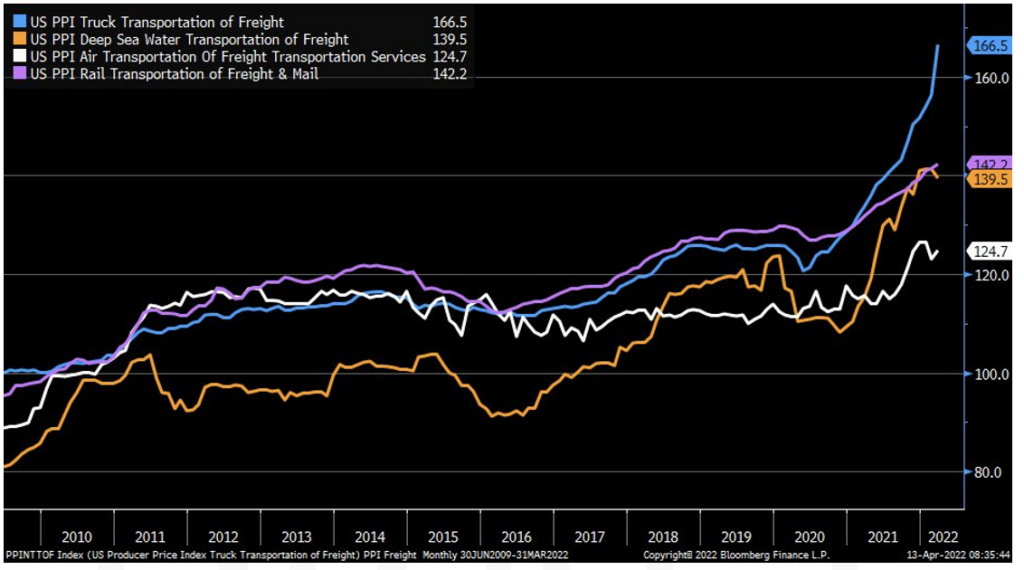
In past notes, we talked about supply chain issues. We’ve seen some costs abate slightly but trucking costs continued to skyrocket. One cause had been that Texas required that every truck crossing the border must be inspected in an attempt to curtail illegal immigrant border crossings causing a significant backlog, with some trucks waiting as long as 30 hours. As much as $1.7 billion in goods come across the border ranging from cars to beer. As of the writing of this report, Governor Abbott has backed off the policy. Producer Prices have increased 11.2%, significantly ahead of the 10.6% estimate.
As China continues it’s extremely strict Zero Covid policy we hope to get an understanding of how it may be impacting their manufacturing capacity as their Industrial Production numbers are released early next week. This COVID Policy is sure to negatively impact the supply chain as exports are already being delayed out of Singapore. Housing starts in the US will be released on Tuesday. Various countries will release their CPI results mid-week and US Jobless claims will be reported on Thursday.
Equities
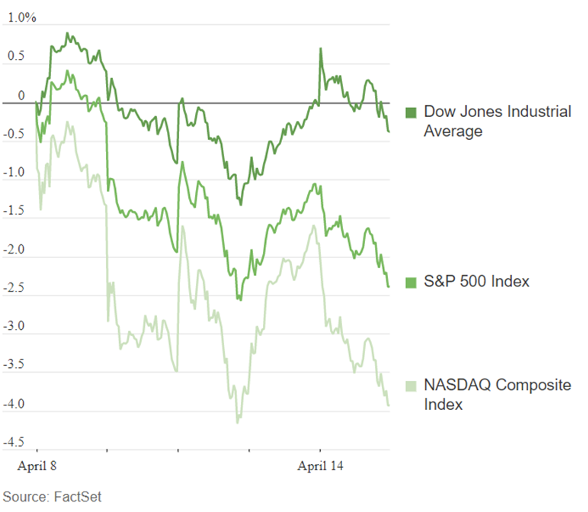
Equity markets moved mostly to the downside during the shortened trading week. Investors reacted to the first of many major corporate earnings reports of 2022 as well as the inflation figures released during the week. The S&P slid -2.37% on the week while the Dow ended -0.38% and the Nasdaq dropped -2.14%.
Goldman Sachs, Citigroup, and Morgan Stanley all reported mostly better-than-expected results, but Wells Fargo missed on revenues and all financial companies noted challenges from the geopolitical and macroenvironments.
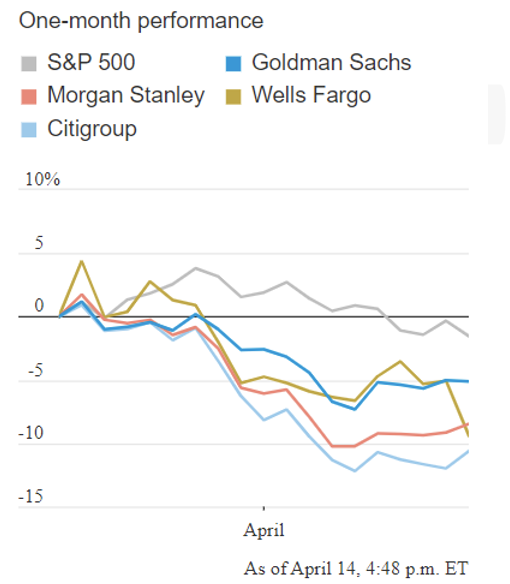
Twitter shares were up nearly 5% on Thursday then fell into negative territory ending the day down -1.7% at $45.08. Elon Musk, who holds more than a 9% stake in the company, offered to buy Twitter outright in a deal valuing the company at more than $43 billion. Twitter’s board enacted a poison pill strategy after the offer was presented so expect more to come. Tesla subsequently fell 3.7% to $985. UnitedHealth Group, a member of the Dow, topped expectations and raised its guidance. As noted, the S&P slid 237 bps – led by Technology -5.07%, Telecommunications -2.46%, Financials -1.65%, Consumer Discretionary -1.50%, and Real Estate -1.46% all posting large negative returns on the week. Real Estate’s move was not surprising this week as mortgage rates reached 5% for the first time since 2011 and Financials were brought down heavily by JPMorgan Chase after missing Wall Street estimates. Energy shares outperformed on the week +3.20%. Value stocks -0.22% continued to outperform their growth counterparts -2.20%, but small-caps regained ground lost the previous week versus large-caps. Europe gained some momentum as markets focused on the ECB’s unchanged monetary policy decision albeit ending the week down -1.10% while the MSCI World ended down -1.72%.
Fixed Income
On Monday, we saw the yield on the U.S. 10-year Treasury Note surpass the yield on the 10-year Chinese government bond. Globally we have seen government bond yields rise this year due to global monetary tightening, but the opposite is happening in China. Below is a chart showing the yield curve dropping on Chinese government issued bonds while yields here in the US are rising. Bond holders of late have been retreating from Chinese national debt due to the geopolitical issues as well as diminishing yields. Foreign investors retreated from Chinese bond markets with more than $15 billion leaving the space in March, the highest on record and the second straight month of overall outflows from the market. Foreign bond holders still hold around $560 billion in Chinese debt including debt issued by Chinese institutions. On a real yield basis Chinese debt is still the winner since inflation in the US is 8.5% compared to Chinese inflation which is around 1.5%, meaning real yields on US Treasuries are currently negative. Chinese local governments have issued 1.25 trillion Yuan ($196 billion dollars) of special bonds to end the month of March. This is an effort to stabilize the local economies and boost growth in regions impacted by Covid outbreaks. The higher March volume makes sense due to the Covid lockdowns in various regions all over China over the past month. They are looking to prioritize regions with lower debt and key investment projects in bond quota allocations. Year to date Chinese local government special bond issuance has reached 1.46 trillion Yuan with an annual quota of 3.65 trillion Yuan.
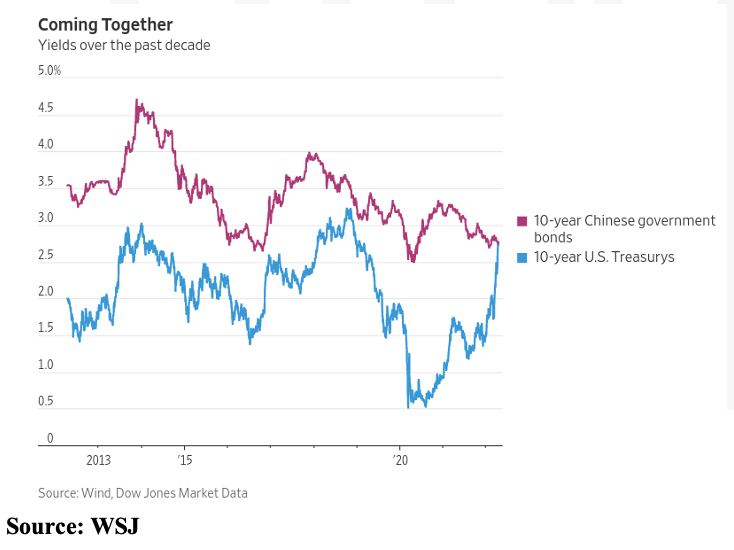
The yield on the 10-year Treasury Note hit multi-year highs this week getting, as high as 2.83%, which is the highest since the end of 2018. At the shorter end of the curve the 2-year Treasury Note saw its biggest single day drop since March 1, dropping 11 basis points Tuesday from 2.506% to 2.387%. The spread this week between the 2-year and the 10-year steepened while the 30-year Treasury Bond remains at the highest levels since May 2019 at 2.919%. The average 30-year fixed mortgage rate hit 5% which is the highest level since February 2011. We have seen rises across the housing market with the 15-year fixed rising to 4.17% compared to hovering around 2% in mid-2021. Ginnie Mae issuance in March reached $51.18 billion, financing more than 189,000 homes and apartment units, down from $53.01 billion issuance in February. This March issuance includes $48.7 billion of Ginnie Mae II MBS and $2.47 billion of Ginnie Mae I MBS which includes approximately $2.31 billion of loans for multi-family housing. The declining volume of issuance is a result of the current rising rate environment due to affordability constraints. As of end of March there was $2.186 trillion total outstanding principal balance, up from $2.175 trillion in February.
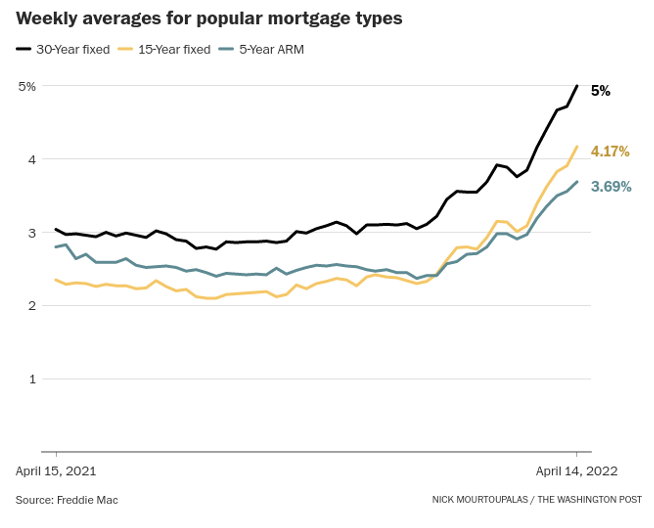
Source for chart: Washington Post
On Monday, the European section of the credit derivatives determinations committee (CDDC) ruled Russian Railway Bonds had defaulted failing to make interest payments of $268 million on bonds due on March 14th. Russian Railways have combatted that ruling stating that they did make payments on the Swiss Franc Bond, but the payment was blocked due to western sanctions. A similar situation is potentially unfolding if the country will go into default because it failed to make debt payments last week worth $650 billion on dollar denominated bonds. The CDDC has been asked to weigh in to determine if the country is in default, but Russia will have a 30-day grace period to make payment from when the debt was due, before they are ruled in default. Russia made debt payments on two sovereign bonds on April 4th that were paid in rubles rather than dollars which causes issues if not resolved by May 4th. The bond payments had no prevision to receive payment in any other currency outside the dollar. Russia has 15 remaining dollar or euro denominated issues outstanding worth $40 billion.
Sources: WSJ, CNBC, NPR, Reuters
Hedge Funds
Globally, hedge funds are holding up well compared to their respective indices’ losses. Through Wednesday, both the MSCI World and S&P 500 both fell 90 bps for the first 3 sessions of the week, the average global hedge fund was up 20 bps and the average Americas-based long/short fund was up 60 bps. MTD, Americas-based long/short funds are only capturing about 1/3 of the index downside while global funds are even better at 20%. Similarly in Asia, funds are capturing
~ 20% of the MSCI Asia Pacific downside. Europe has been more challenged on a relative basis with the average fund down ~30 bps and long/short fund down ~60 bps while the Euro Stoxx 600 is up +50 bps MTD. A positive driver in all regions is crowded short alpha as those shorts are down more than their respective indices. Europe and Asia also have positive crowded long alpha. Regarding positioning, single-name long/short ratio has fallen in all regions since the beginning of the year and continues to do so in April but remain above longer-term averages (2010-2019) in all regions except Japan. There was little change in net activity except for selling from macro products. On a sector level, after 2 weeks of net selling, US tech was net bought led by semiconductors and software. Hedge funds also sold rate sensitive financials amid the start of Q1 earnings reports and bought capital markets stocks.
Private Equity
After a record setting 2021, PE deal activity has seen a relatively slower start to 2022. The combination of Russia’s invasion of Ukraine and the threat of higher interest rates escalated supply chain disruptions, increased inflationary pressures has put a halt to the financing markets. As a result, dealmakers have started to bypass the traditional syndicated loan market and $1 billion+ private debt facilities are becoming commonplace. After a turbulent first two months of Q1 2022, public equity markets largely rallied in March, suggesting investors expect a calmer market in the coming months.
US PE exit activity has also seen a slow start to 2022. Public listings drove the record setting exit activity in 2021 but dropped substantially in Q1 of 2022. Given the geopolitical climate and market volatility sponsors are holding onto portfolio companies amid steep stock market declines and valuation adjustments. As exits continue through other sponsors or corporations that look to take advantage of market volatility, analysts suspect public listings will return when the markets calm, however we may see much lower valuations.
The alternatives fundraising environment continues to press forward with capital flowing into IT as investors focus on attractive growth prospects and healthcare specifically in healthcare IT and value-based care. Additionally, energy investments are becoming increasingly more attractive given fears sparked surrounding oil and gas shortcomings stemming from the Russia-Ukraine conflict.
Data Source: Bloomberg, CNBC, the Daily Shot HFR (returns have a two-day lag), Financial Times, Fund Fire, Morningstar, Pitchbook, Standard & Poor’s, the Wall Street Journal, Morgan Stanley, Goldman Sachs and IR+M
This report discusses general market activity, industry, or sector trends, or other broad-based economic, market or political conditions and should not be construed as research or investment advice. It is for informational purposes only and does not constitute, and is not to be construed as, an offer or solicitation to buy or sell any securities or related financial instruments. Opinions expressed in this report reflect current opinions of Clearbrook as of the date appearing in this material only. This report is based on information obtained from sources believed to be reliable, but no independent verification has been made and Clearbrook does not guarantee its accuracy or completeness. Clearbrook does not make any representations in this material regarding the suitability of any security for a particular investor or the tax-exempt nature or taxability of payments made in respect to any security. Investors are urged to consult with their financial advisors before buying or selling any securities. The information in this report may not be current and Clearbrook has no obligation to provide any updates or changes.
