Economic Data Watch and Market Outlook
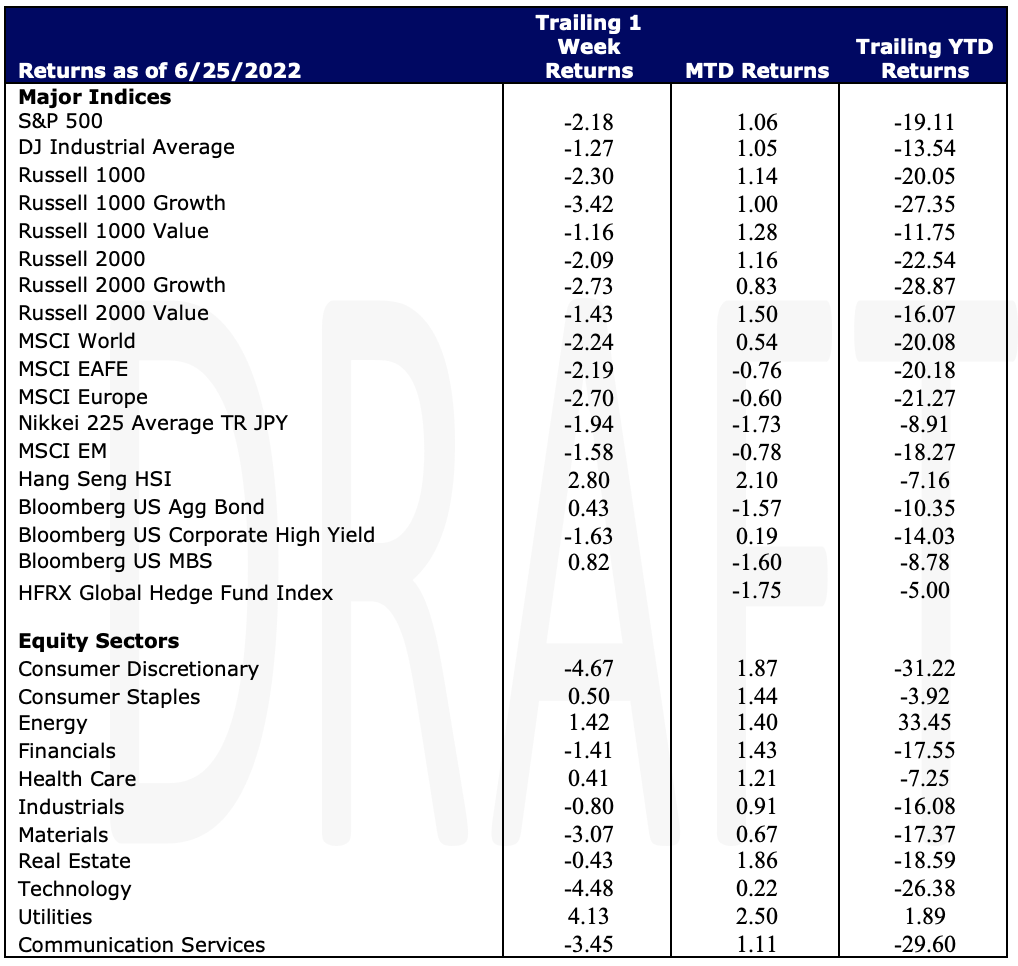
Global equities fell for the week between 2% and 2.75%. Thursday marked the quarter-end and the decline in stocks was the largest first half drop since 1970. Bonds, as measured by the Aggregate Bond Index, finished the week up slightly but fell 10.35% in the first half of the year. Expectations are that the Fed will continue to aggressively raise rates at its next meeting in a month. The Fed’s dual mandate is to control prices and maintain employment, not manage the stock market or keep the economy out of recession.
Mainstream media has highlighted that some retailers are struggling to manage higher than expected inventories. This datapoint is related to the consumer but also the management of the retailer to manage demand. Missteps can contribute to a slowdown in the manufacturing of goods. To that end, it is important to watch the ISM data which has been trending lower as one would expect with such high demand caused by COVID related stimulus.
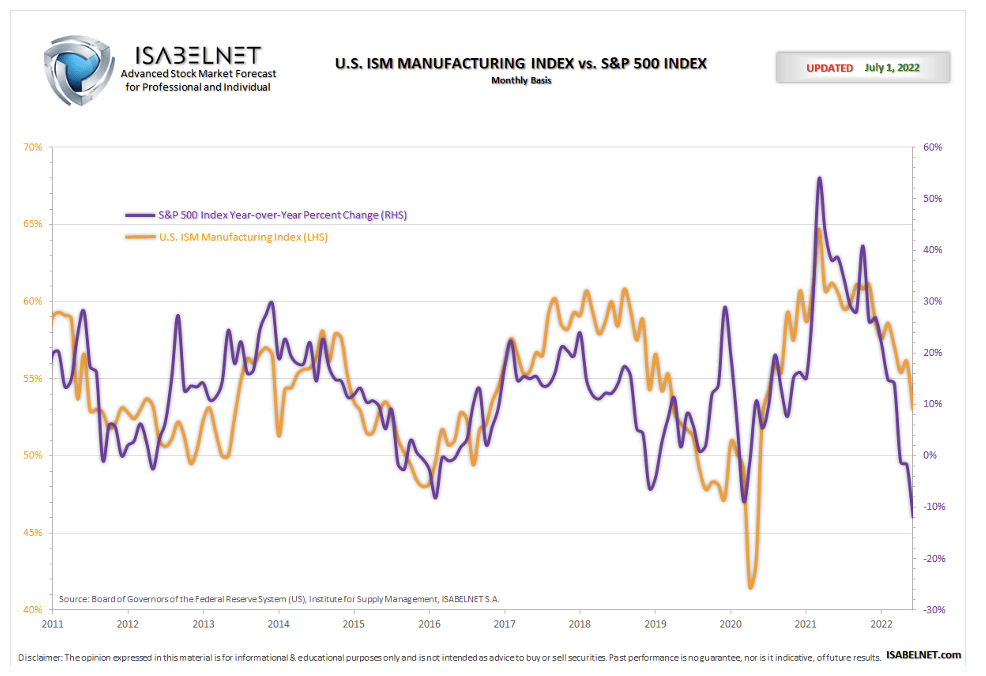
While we’re seemingly at full employment with more jobs available that people to fill them, a decline in manufacturing can signal a slowdown in employment. As companies ramped up in 2021, many hired (and some still are) indiscriminately. The flip side is some are already starting to lay off workers, such as Tesla announcing this week that they are laying off 200 autopilot workers. This alone is not alarming but as rates continue to increase it will put more pressure on companies to trim excess costs to maintain earnings or limit the downside.
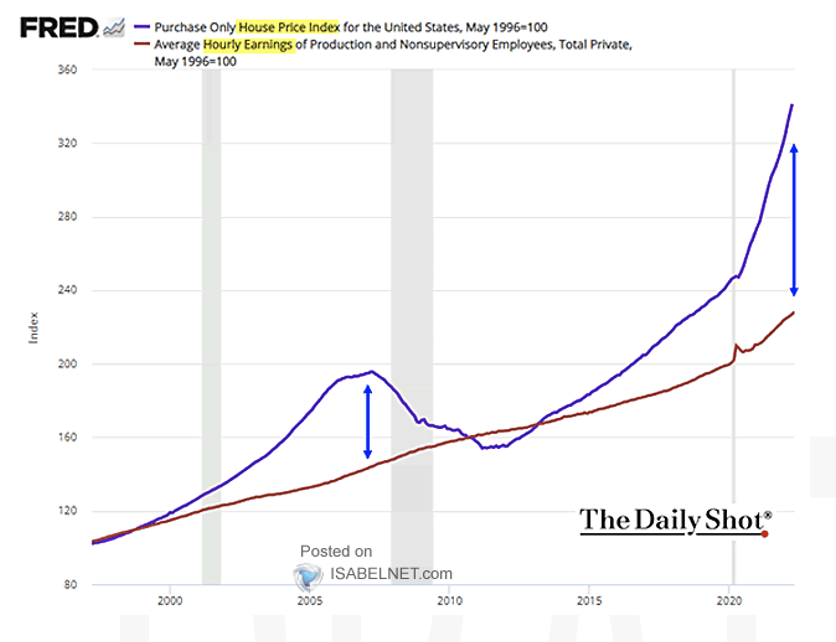
As we think about employment growth and wages, we continue to monitor how they relate to housing. Housing prices have continued to outpace average hourly earnings which could cause consumers to extend their credit profile. The consumer balance sheet remains healthy, but inflation and a prolonged recession will likely impact those that over-extended themselves.
Equities
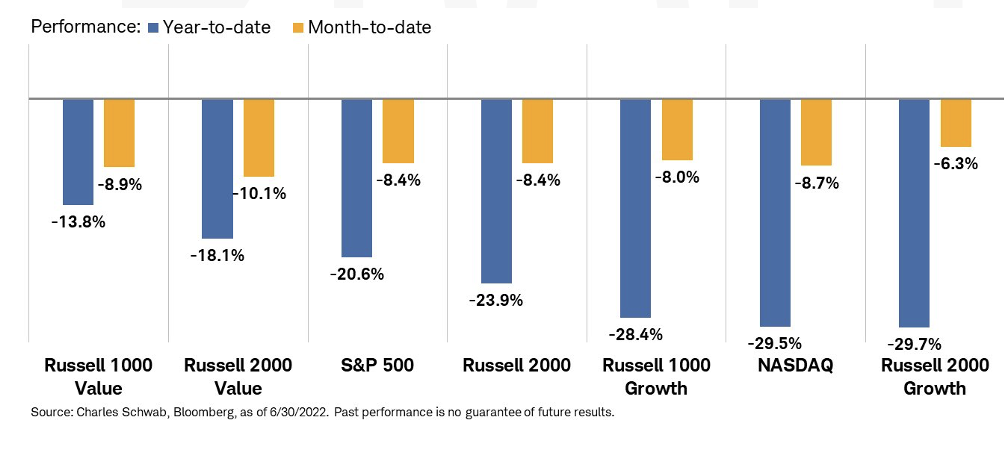
Stocks gave up a bit after last week’s gains as the S&P 500 fell 2.18%. Charts below are as of 6/30 and don’t reflect the modest bounce on Friday. Investor’s appetite for risk continued in the second quarter as the Fed continued to reign in inflation As the Fed raised rates, within context of the P/E ratio, Price, the ‘P’ was the initial story with most believing that the economy would remain strong. Perhaps investors did not discount the resolve of the Fed to bring inflation under control at the expense of economic growth until May. Concerns began to mount as earnings, the ‘E’ portion of the P/E ratio, would start to shrink. This left stocks to shrink further in June.
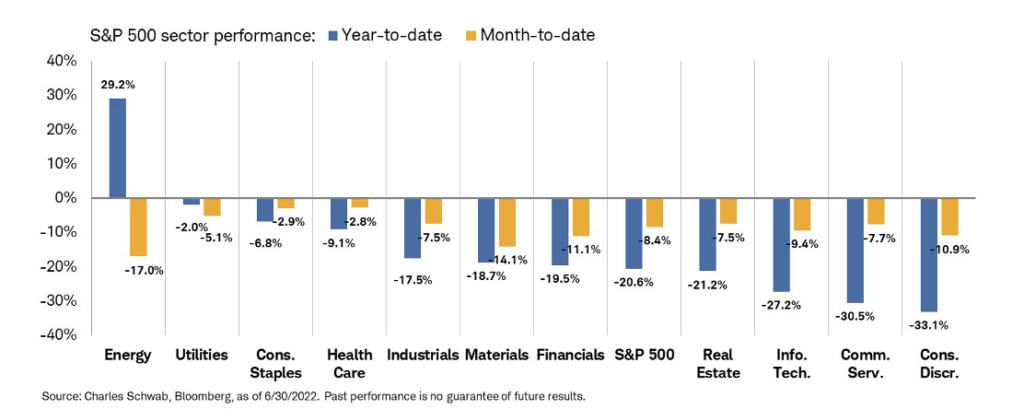
Stocks in Europe fell at roughly the same pace on the week with the MSCI Europe benchmark falling 2.19%. The Nikkei index fell 1.94%. The Bank of Japan has been aggressively buying bonds to maintain its yield cap (25 bps on its 10 year). This has caused the yen to slide significantly. EM stocks fell for the week, 1.58%. That return was dampened somewhat as China began to ease COVID related restrictions. Hong Kong stocks rose 2.8%.
Fixed Income
Treasuries moved higher in the week with yields losing pace, as action in the bond markets remains variable with the Fed aggressively tightening policy amid the backdrop of a slowing economy. The yield on the 2-year Treasury note was down 12 bps to 2.96%, the yield on the 10-year note decreased 10 bps to 3.00%, and the 30-year bond rate declined 5 bps to 3.16%.
10-year Treasury yields were lower again towards the end of the week, falling below 2.9%, and notably down from their June highs. Over the last few months, the yield curve has flattened as tighter Fed policy has prompted a sharper move in shorter-term rates.
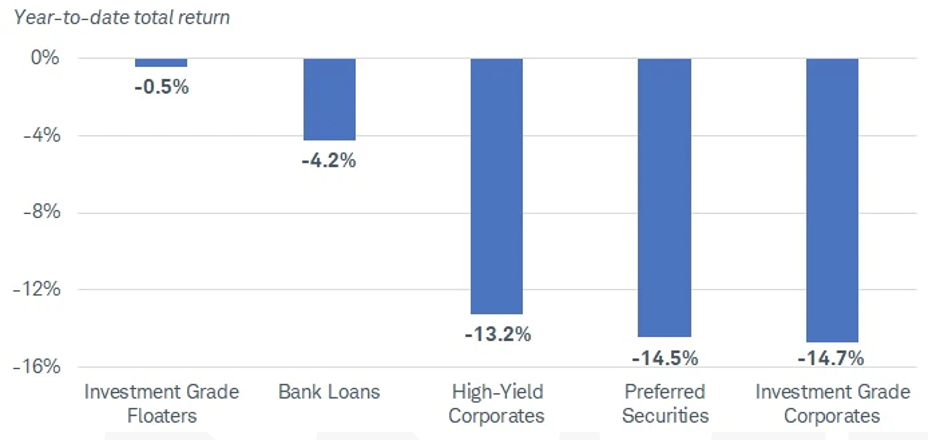
Corporate bonds ended the first half of the year down over 10%. The drop in prices was powered by increased Treasury yields and rising credit spreads, as investors demanded additional yield to compensate for the risk of slower economic growth and the potential for corporate profits to decline. Central banks continue to emphasize their desire to control inflation via balance sheet reductions and rate hikes, with no regard for what it will do to economic growth. Looking forward, there is the possibility that corporate margins be under significant pressure from both slowing consumer demand, as well as higher input costs. Though, corporate bonds were not the only laggard among the fixed income asset class, as even short-term bonds and those with floating coupon rates suffered declines.
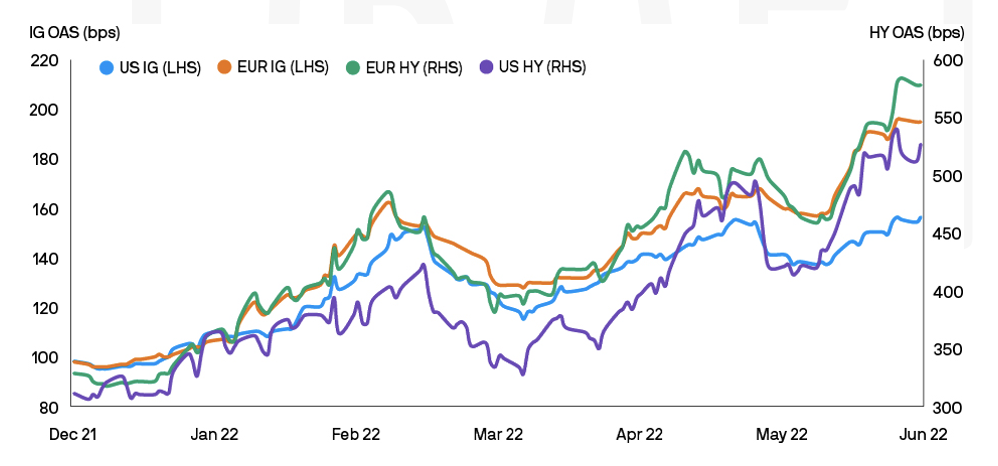
Investment grade and high yield spreads have increased dramatically this year amid the market volatility. Eurozone IG and HY spreads have widened by about 100 bps and 260 bps, respectively, off their lows in January. The European markets have both underperformed their US equivalents as investors have discounted the more immediate impacts of the Ukraine crisis and the increasing risk of recession.
Spreads across the ratings spectrum in the US and Europe have widened considerably so far this year. The below chart shows historical data covering 11 recessions back to the 1950s; IG spreads generally price in a recession at around 240 bps, though an over exaggerated estimate is expected in a volatile period. The US IG market is currently pricing a 40% probability of recession, versus the European IG is pricing in closer to 70%.
The number of downgrades has begun to pick up for HY bond issuers. Thus far in 2022, borrowing costs have risen, the corporate profit outlook is questionable, and demand is looking like it may slow. There was a notable uptick in downgrade activity of HY-rated issuers over the last two months, with the number of downgrades outpacing the number of upgrades. For IG issuers, the number of downgrades remains reasonably low.
Jaded retail demand for both IG and HY continues to characterize the deteriorating technical backdrop. The withdrawal of the ECB’s Corporate Sector Purchase Program marked the exit of the “buyer of first resort” in the European credit markets. US IG markets have seen consistent week-on-week outflows over the course of the year. Secondary liquidity is dismal in US HY, with investor positioning reaching new bearish milestones.
Hedge Funds
During the last week of the month, hedge funds gave back their gains with the average global fund down ~70 bps while the average Americas based long/short equity fund was down ~190 bps. For the month of June, the average global fund was down ~1.9% which compares very favorably to the MSCI World that declined 8.4%. The Americas-based long/short equity group was down more than 3.4% but also compared favorably to the S&P 500 that declined 8.26%. Both are outperforming their respective indices YTD with global funds down 4.9% and Americas L/S down 12.7% (compared to down almost 20% for both the MSCI World and S&P 500). European-based funds declined only ~20 bps for the week putting the group at -2% for the month (Euro STOXX 600 -8%) and only -2.3% YTD (Euro STOXX 600 -14.42%), making the region the best performer for the month and 2022. Asia funds were down ~ 40 bps for the week and positive for June at +70 bps compared to -6.4% for MSCI Asia Pacific. Crowded longs underperformed their respective indices in all regions, but crowded shorts worked well leaving the spread for North America and Europe positive. Regarding flows, hedge funds were net sellers globally. In North America, most of the net selling was in energy but also included healthcare (pharma), financials (capital markets) and utilities. Flows to TMT were mixed with outflows in software and semis (short adds) and inflows in telecom, tech hardware and internet retail. China had been heavily net bought in the first 3 weeks of the month, but the last week saw a reversal as the buying slowed then flipped to sales.
Private Equity
As Q2 2022 comes to a close, an overwhelming majority of mobility tech SPACs are trading below their IPO price, implying as a group the companies are worth roughly $100 billion less than their deals implied. Traditionally, SPACs go public with an IPO price of $10 per share, a typical benchmark given how SPACS have been received in the past. Of the 60 mobility tech companies who have had an IPO in the past year, 68% or 43 companies are trading at less than $5 per share. Additionally, fifteen of these companies have seen their shares fall more than 90% from their 52-week high. At the close of Q2 only four of the companies are currently trading above the $10 per share price.
Given mobility tech SPAC’s current market stats, venture capital funding in this space has also diminished. In Q1 2022 startups raised $13.9 billion across 318 deals which equates to approximately 43% of the total raised in this space just one year ago in Q1 2021. Analysts remain hopeful that the macro outlook for this space still remains strong as electric vehicle adoption continues to gain significant momentum with continued projected growth over the next decade.
Data Source: Bloomberg, BBC, Charles Schwab, CNBC, the Daily Shot HFR (returns have a two-day lag), Jim Bianco Research, Market Watch, Morningstar, Pitchbook, Standard & Poor’s, the Wall Street Journal, Morgan Stanley, Goldman Sachs and IR+M
