Economic Data Watch and Market Outlook
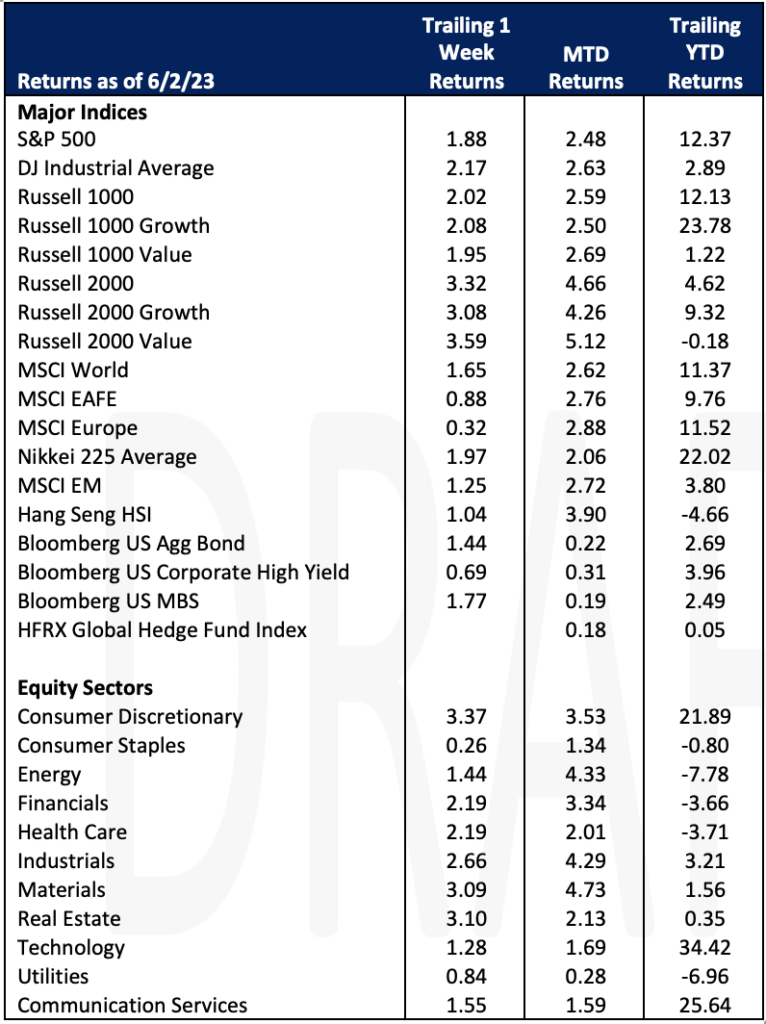
Global equities and fixed income markets advanced for the week (S&P 500 +1.88%, MSCI World +1.65%, and the Bloomberg Aggregate Bond index+1.44%). Investors were relieved as the US averted a potential debt default with the Congressional passage of a debt limit increase that was signed by President Biden on Saturday. The debt ceiling obstacle has been weighing on investors over the last few months. Most assumed that like past deals, an agreement would be made in the final few days before the Federal Government ran out of money. As the deal began looking more likely, the CBOE Volatility Index (VIX), also known as the market’s fear gauge, continued to fall during the week ending at 14.82 on Friday, its lowest close since Feb. 19, 2020.
On Friday, the May Nonfarm Payrolls number significantly surpassed estimates coming in at 339K versus an estimate of 195K. The prior month was also revised upward by 41,000 jobs, to 294,000 from 253,000. Markets have largely been expecting the Fed to “skip” a rate increase at the June 14th meeting, but the labor market continues to make that expectation difficult.
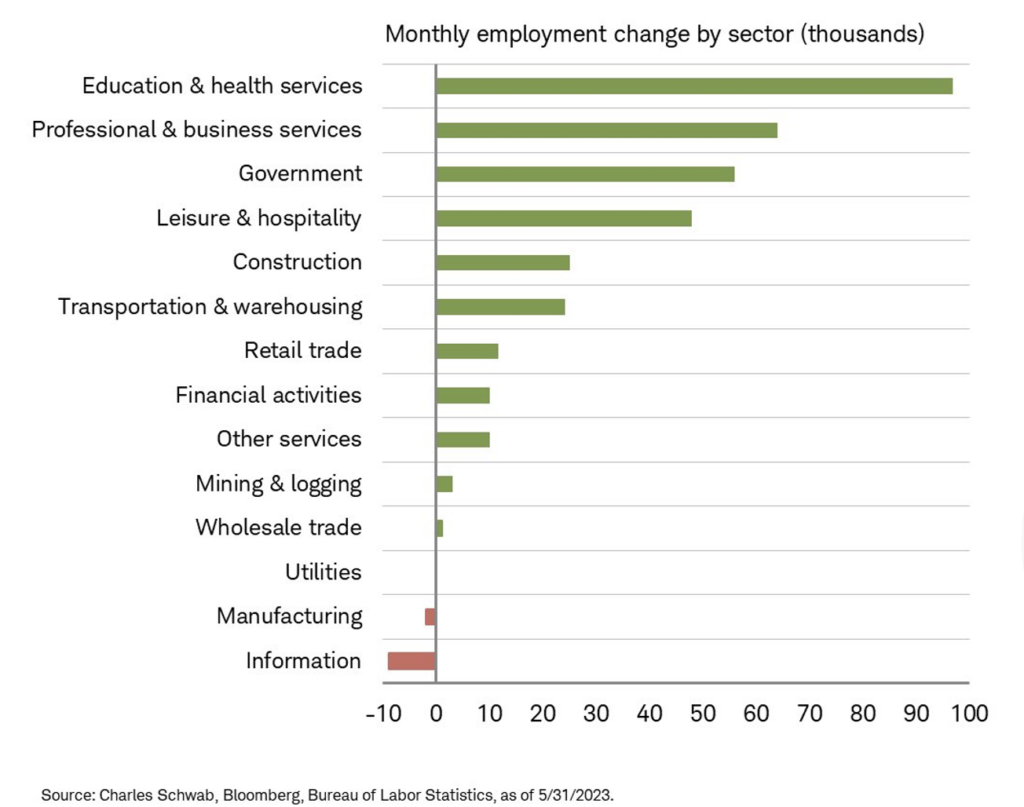
The biggest monthly increase came from Education and Health Services and decrease from the Information Technology sector.
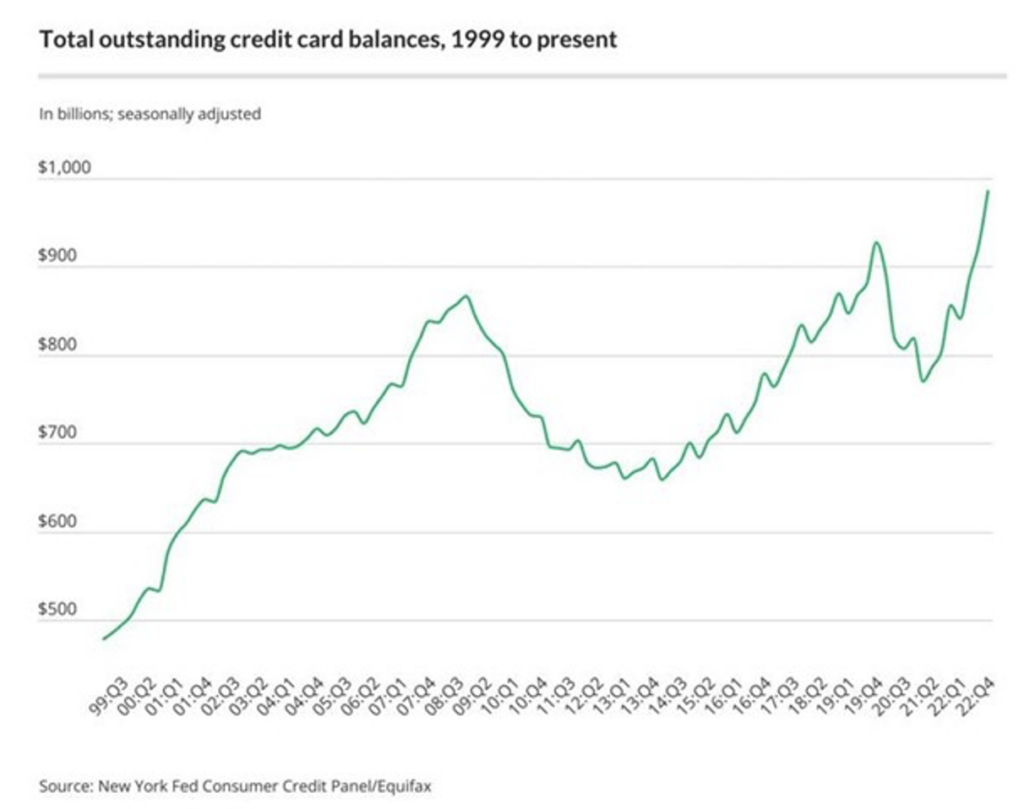
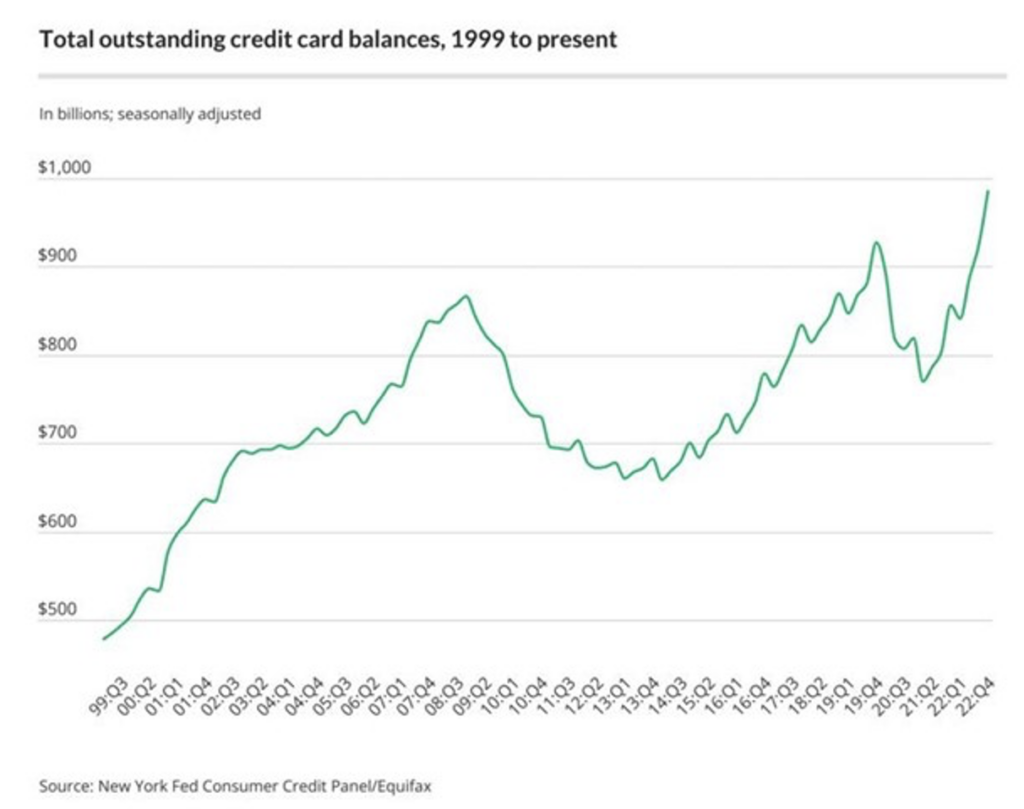
The leisure and hospitality sectors continue to grow in addition to jobs in the retail sector. Consumers continue to spend but it could be a result of taking on credit card debt. As we’ve noted in the past, credit card debt has steadily increased. Despite declining because of stimulus, the trend reversed and is not at an all-time high.
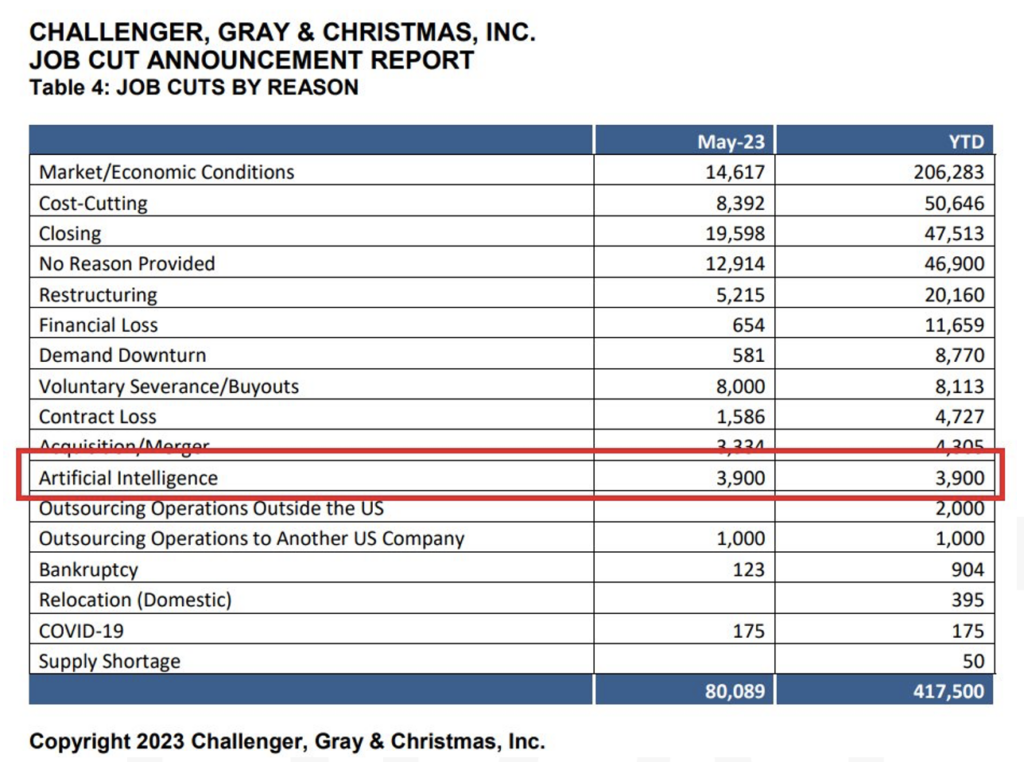
Artificial intelligence (AI) continues to be a hot topic in all sectors and how it will impact jobs in the economy. NVIDIA became one of the few companies with a trillion-dollar market cap as a result of recent sales of their equipment catering to AI. The table below shows a recent survey as to reasons job cuts have been made. While AI is one of those reasons, it is currently small relative to other reasons. We continue to be skeptical of this in the short term and view it as a reason companies will use to find ways to cut costs and push layoffs because of labor hoarding that took place because of Covid.
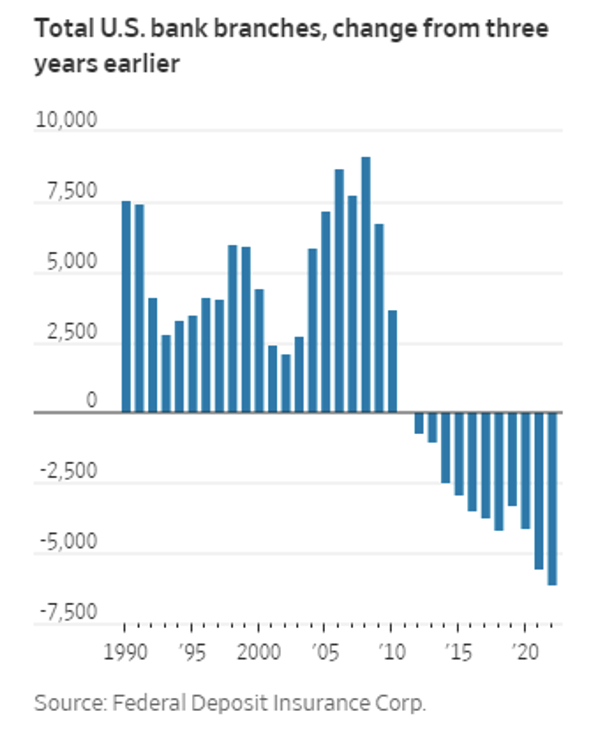
Deposits rose quarter over quarter at online banks such as Ally, Goldman Sachs – Marcus and Capital One. The transition towards online banks has been taking place for some time, as roughly 6,100 branches closed between 2019 and 2022, the highest number of closures over a 3-year period in history. That said banks such as JP Morgan have increased their banking footprint, opening branches in 25 new states while reducing its overall network size by 100s of branches since 2018.
The week ahead will provide insight into Non-Manufacturing ISM data and jobless claims toward the end of the week. The Fed has entered its quiet period so we will likely see a fair amount of market speculation ahead of the June 14th meeting.
Equities
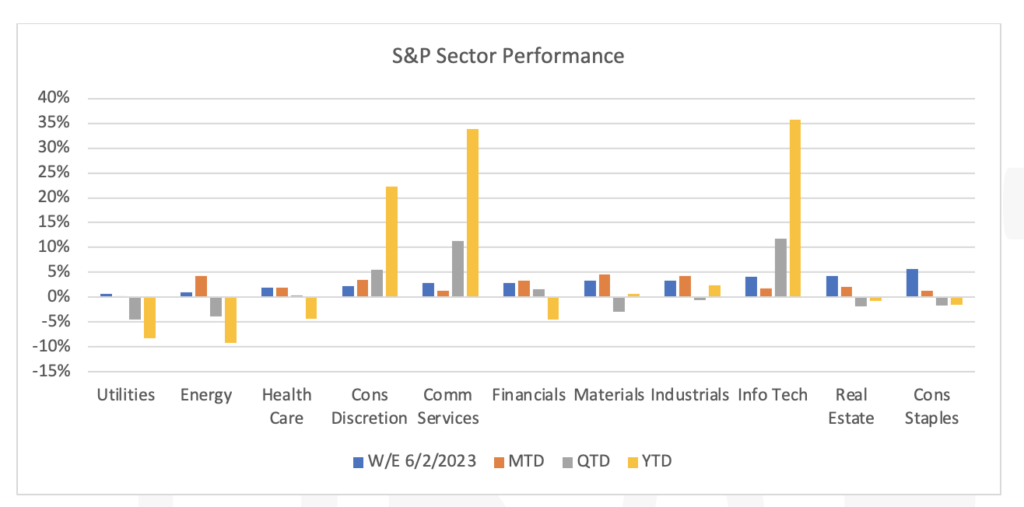
After the slew of positive news (Congress this week passed the debt ceiling bill, Jobs report), the equity markets rallied Friday and were up for the week (Dow: +3.05%; S&P: +1.88%; Nasdaq: +4.27%). All S&P sectors participated in the gains this week led by Consumer Staples (+5.73%/week), Real Estate (+4.26%/week) and Information Technology (+4.08%/week) stocks.
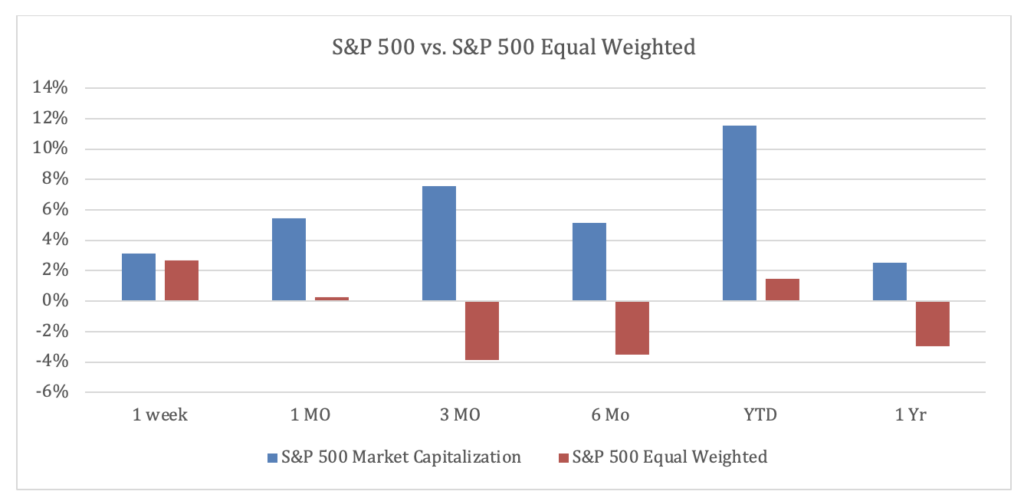
The S&P 500 index has risen 9.6% year to date driven by the large cap technology companies (Nvidia Corp. (NVDA: +3.54%/week; +37.12%/month), Alphabet Inc. (GOOGL: +0.98%/week; +18.09%/month) and Apple (AAPL: +4.60%/week; +4.25%/month). Contributing to the investor optimism in large tech comes from Nvidia having offered 2nd quarter revenue guidance of nearly $4B more than consensus (May 25th) resulting in the S&P 500 Asset Weighted Index significantly outperforming the S&P 500 Equal Weighted Index YTD.
Other news in the market: Lululemon Athletica Inc. (LULU: +6.75%/week) gained this week as they reported a revenue increase of 24% from a year ago and same store sales increased by 14%. This helped other retail sector sportswear brands on Friday such as Nike (NKE: +3.99%) and Dick’s Sporting Goods (DKS: +1.73%) end higher on the day.
European markets for the week (FTSE 100: +0.19%; DAX: +1.89%; Euro STOXX 600: +0.72%) and Asian markets (Hang Seng: +1.13%; Nikkei: +1.97%; Shanghai: +0.55%) rose on the news of the US Debt Ceiling bill passing.
Hong Kong’s Hang Seng Index finished 4% higher on Friday as news that the Chinese government is considering a package to support the property market. American Depositary Receipts of big Chinese firms such as Alibaba Group (ticker: BABA) and Baidu (BIDU) were trading more than 2% higher. JD.com (JD) rose 4.2% on the news.
Fixed Income
Yields rose across the curve for the month of May, with the 2-year Treasury yield climbing 36 bps, the 10-year Treasury yield rising 20 bps, and the 30-year Treasury yield rising 18 bps. Yields trended downward in the last week of May in response to debt ceiling negotiations ending. The 2-year Treasury yield fell 4 bps, the 10-year Treasury yield fell 11 bps, and the 30-year Treasury yield fell 8 bps. The Bloomberg US Aggregate Bond index rose 1.44% for the week while the Bloomberg US Corporate High Yield Index rose 0.69%, and the Bloomberg US MBS Index rose 1.77%. Meanwhile mortgage rates are climbing after a relatively stable 2-month period. Since May 11th, the Freddie Mac Primary Mortgage Market Survey has risen from 6.35% to 6.79% and as of June 1st, an increase of 0.44%.
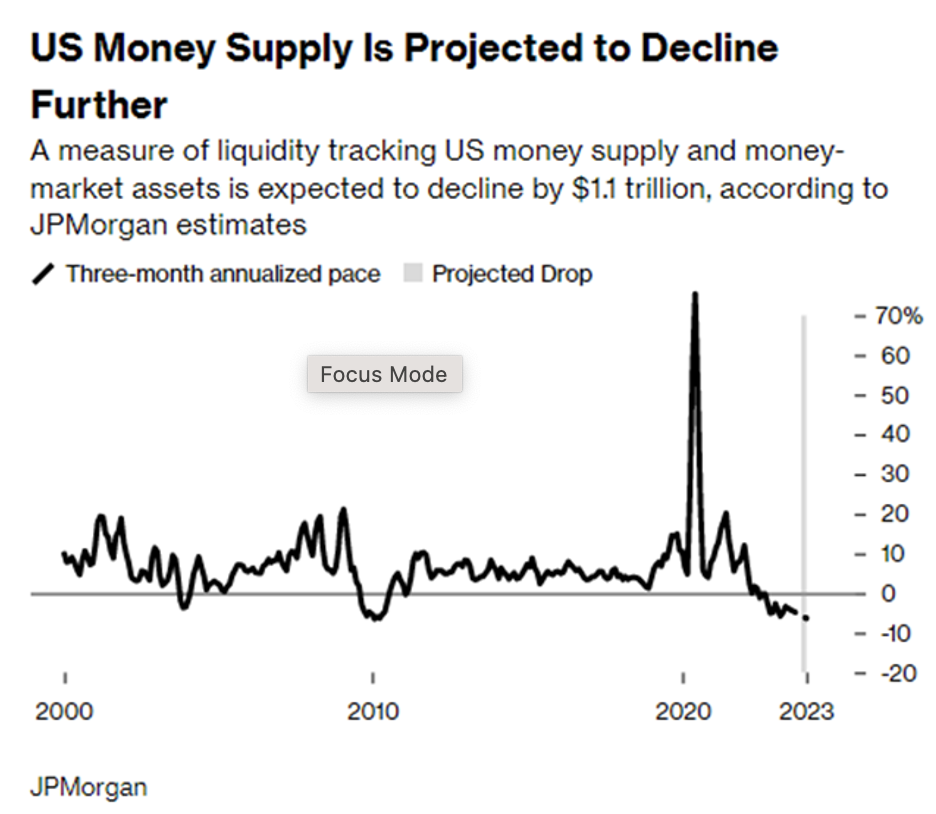
As the debt ceiling deal is wrapping up, the US Treasury is set to unload a large amount of new bonds to refill its reserves, initially auctioning off $170B in T-bills on Monday. JP Morgan strategist Nikolaus Panigirtzoglou expects that the inflow of new Treasuries will increase the effects of quantitative tightening and negatively affect stock and bond performance by 5% this year. JP Morgan estimates that liquidity will fall by $1.1T by the end of the year from $25T at the start of 2023.
On Friday, US Treasury officials met with China’s new ambassador to the US, Xei Feng. The discussion was centered around maintaining open communications between the world’s two most powerful economies. There was emphasis by Treasury officials to focus on working together through future global challenges. In April, US Treasury Secretary Janet Yellen stated that she hopes to visit China this year to strengthen ties between the two nations, and responsibly manage the relationship.
Hedge Funds
Performance was mixed across the globe as HFs closed out the month of May this week. The average global fund ended the month down -29 bps vs. the MSCI World down -1%, while the average US L/S equity fund outperformed the S&P 500 gaining 72 bps vs. the S&P up 43 bps. Performance was tougher in relative terms in Europe as the average EU L/S equity fund captured ~50% of the benchmark downside losing -1.3% vs. the Euro STOXX 600 down -2.3%. Asia performance was most challenging in relative and absolute terms as the average Asia L/S lost -2% and the average China L/S lost -2.4% against the MSCI Asia down -97bps. The top 50 crowded longs and shorts worked well in the US as the L/S spread for the week was 47 bps, despite shorts gaining 66 bps vs. the S&P +42 bps. This is consistent given the L/S spread for the month of May was positive (+2.7%) though shorts did outperform the index. In Europe, crowded names did not explain the underperformance as they worked well on both sides. The spread ended the week at +1.4% and closed the month at +73bps. In Asia, shorts were challenging this week as the L/S spread was -59 bps, while on the month both longs and shorts were weaker as the L/S spread sits at -6.9%. HFs were buyers of US equities this past week while other regions were net sold. In NA, even though tech was heavily bought throughout the month, this past week HFs were buyers of other sectors such as financials, healthcare and industrials. That said, the L/S ratio for tech is back to the highest level since late 2021 (though just 50th percentile since 2018) and net exposure (as a percentage of total HF net exposure) is at 5-year highs. Positioning remains high towards US semiconductors as semiconductor flows have also turned positive again, though not as extreme as mega cap tech over the past month. In China, the selling was mostly in H-shares with the pace of selling in A-shares and ADRs slower. Flows were more muted in Japan. Outside of long/short equity, and staying with the tech theme, CTAs have gotten a lot longer Nasdaq in the past few months, while staying short the Russell 2000. The difference between exposure to these two is at historical extremes (and a complete flip from mid-4Q22).
Private Equity
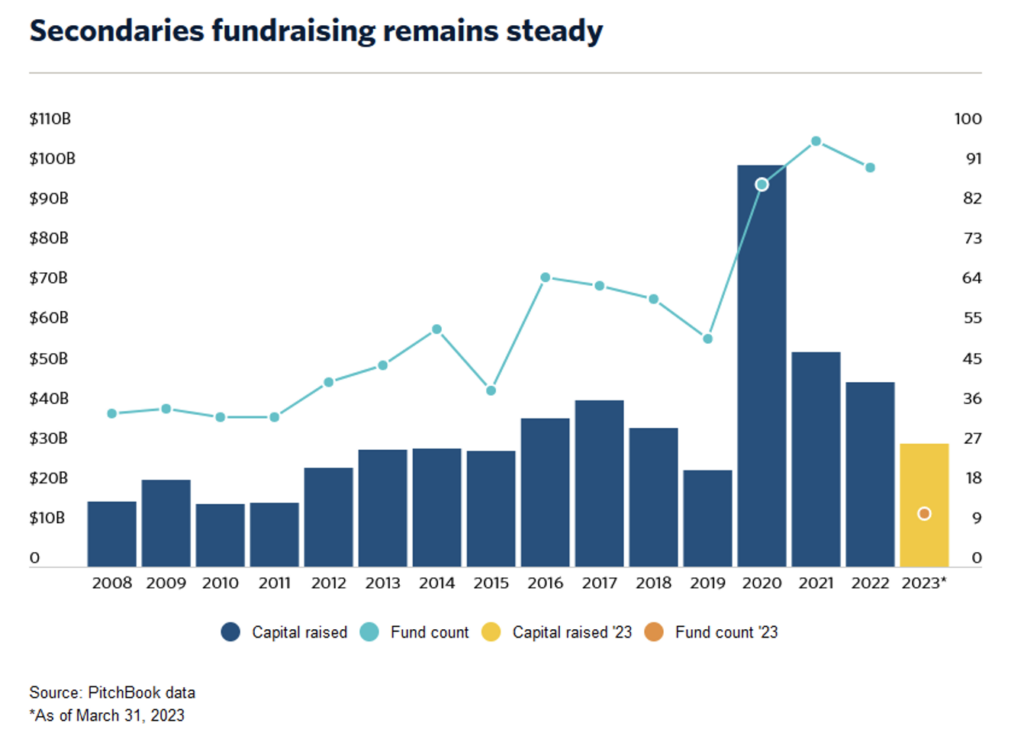
Secondaries continue to present opportunities in 2023. On a year over year basis, from March of last year to 2023 the strategy saw positive change in capital raised where others could not say the same. Fundraising for secondaries increased 39.6% while fund-of-funds and private equity both saw negative total fundraising over the same time frame. Secondaries should continue with a stressed market environment as a liquidity option for both GPs and LPs. Looking at the first quarter alone secondary fundraising has already met roughly 66% of 2022’s total which is the second highest quarterly figure to record. With a struggling IPO market and macroeconomic tension, many IPO shareholders are seeking refuge for liquidity in the secondary market. For new investors, this also creates an opportunity due to private companies trading at large discounts to their original funding round creating an attractive entry point. Fund flows for secondaries have been dominated by bigger and experienced managers such as funds with vintage years of 9 years or older and majority of capital raise has been to funds over $5+biilion mark in AUM. Some of the interest to allocate to experienced managers in the space is driven by the economic uncertainty that has been seen over the past year. There is in aggregate $167.6 billion in dry powder that secondary funds are holding and ready to deploy.
Private credit funds (PCFs) making loans to VC-backed startups have posted strong Q1 earnings mostly due to rising demand for debt financing. Most of the loans made are floating rate so as we saw rates increase, so did their net income. As venture-backed companies search for alternative ways for funding many are turning to PCFs that specialize in these types of loans. The venture space has struggled this year in search for capital in both the equity and debt markets that was exacerbated by the bank failures. Looking at a set of five funds that also have BDCs making these loans to VC-companies, have raised their quarterly dividend on a year over year mark as well as reporting relatively low losses despite the current VC market. Some analysts are expecting these companies will start to see losses over the next few quarters as valuations drop. The venture debt BDCs have started to become more wary to make loans when we hit the mid-year mark last year. Many loans now made by these PCFs ask for a warrant kicker as well which could help if they do see losses on these loans. These VC PCFs mentioned above also have quite a bit of dry powder totaling a combined $1.2 billion at the end of Q1 2023. The collapse of Silicon Valley bank, a main lender to the VC community, has only created a bigger opportunity for non-bank lenders.
Data Source: Apollo, Bloomberg, BBC, Charles Schwab, CNBC, the Daily Shot HFR (returns have a two-day lag), Goldman Sachs, Jim Bianco Research, JP Morgan, Market Watch, Morningstar, Morgan Stanley. Pitchbook, Standard & Poor’s and the Wall Street Journal.
